5.28% Treasury Yield Tests Houston Apartment Refinancing
Expensive long-term money can constrain loan proceeds even as Houston apartment leasing improves.

Key takeaways
- 5.28%: Official 10-year Treasury yield on October 7, after 5.31% on October 5.
- 5.67%: Official 30-year Treasury yield on October 7; different maturities carry different pricing.
- 6,177 units: Houston Q2 apartment net absorption in Cushman & Wakefield’s report.
- 2.3%: Year-over-year decline in Houston Q2 effective rents in the same report.
Houston apartment owners have a fresh financing hurdle: the official 10-year Treasury yield stood at 5.28% on October 7, after reaching 5.31% on October 5. The Treasury Department’s daily curve shows that long-term money remains expensive even when a day’s trading provides some relief. For a property approaching maturity, the central question is how much debt its current income can support.
A stronger leasing season can improve operations while refinancing still requires additional equity. That is the tension to watch: occupancy and financing capacity can move in opposite directions. Houston investors should evaluate the operating recovery and the capital structure separately before deciding that a lower purchase price or a shrinking supply pipeline solves the whole problem.
The benchmark is only the starting point
Treasury’s official series uses an interpolated constant-maturity curve based on indicative bid-side quotations near 3:30 p.m. Eastern. A live quote or another provider’s closing yield can differ because the instrument, timestamp and calculation differ. The chart keeps one official series throughout, rather than stitching together the most dramatic number from each source.
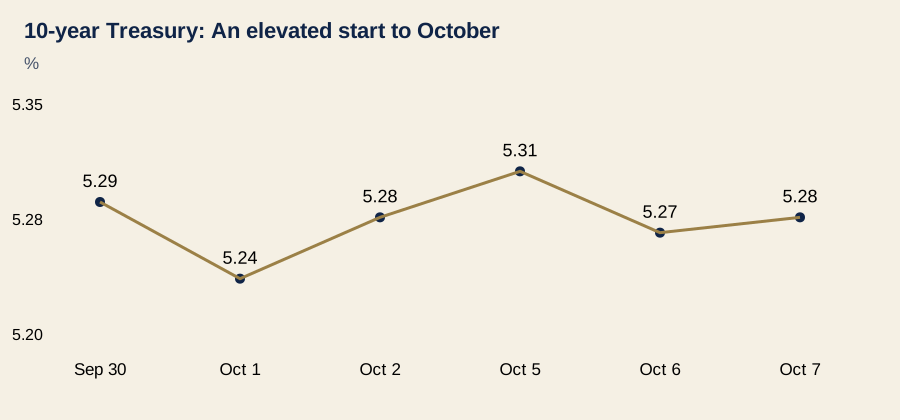
Source: U.S. Treasury daily par yield curve, September 30–October 7, 2026. Official constant-maturity observations; trading days only, not live quotes. Axis shown from 5.20% to 5.35%.
An apartment loan adds lender pricing and transaction terms to its benchmark. The borrower’s proceeds also depend on property income, required coverage, amortization, reserves and the lender’s valuation. Consequently, a Treasury yield establishes financing context; it cannot establish the rate or leverage available on a particular Houston asset.
Floating-rate borrowers face a different reference point. The New York Fed’s SOFR methodology describes an overnight secured funding measure, whereas a 10-year Treasury reflects a much longer horizon. A move in long yields therefore does not translate mechanically into the same change in a floating-rate coupon; the actual loan agreement and hedge determine the exposure.
The distinction matters when evaluating a refinance into fixed-rate debt. That transaction may reduce uncertainty about future interest expense while accepting today’s long-term pricing and prepayment constraints. Choosing between structures requires comparing total costs and flexibility, not simply picking whichever benchmark looks lower on a screen.
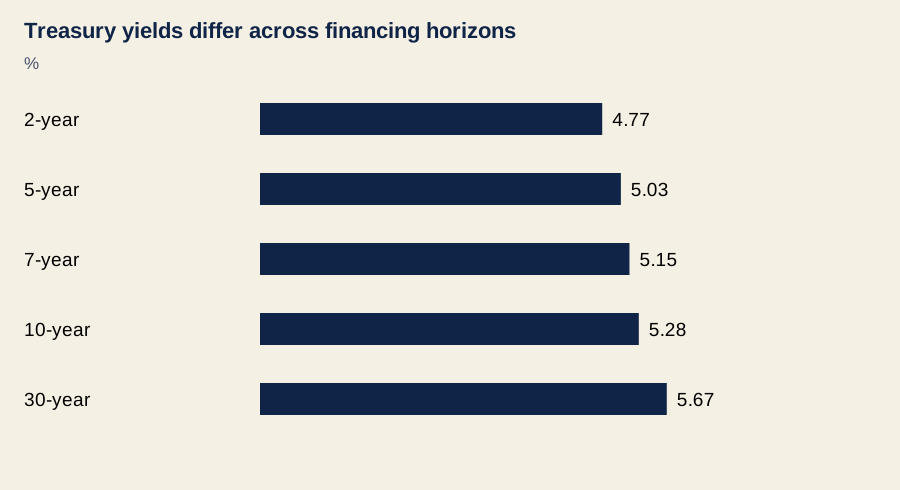
Source: U.S. Treasury daily par yield curve, October 7, 2026. Selected maturities; annual yields, not apartment loan rates. Bars start at zero.
Houston’s leasing recovery needs to become cash
The local operating backdrop offers progress, with important limits. Cushman & Wakefield’s second-quarter apartment report records 6,177 units of net absorption, stabilized vacancy of 11.1% and effective rents averaging $1,312 per unit. Those rents were down 2.3% from a year earlier, showing why improved leasing alone cannot be treated as an immediate income rebound.
Colliers’ separate second-quarter report records 7,008 units absorbed and 13,274 units under construction; Cushman reports 11,756 under construction. The reports publish different totals, and their public summaries do not fully reconcile coverage or other methodological differences. Keep the figures within their respective series; averaging them would create an unsupported market statistic.
Both reports are older operating context for this week’s financing story. They do not establish October occupancy or the collections at a specific building. Owners need to bridge the market narrative to their own rent roll: occupied units, concession schedules, bad debt and renewal terms all determine how much of the leasing improvement reaches net operating income.

Employment adds another reason to avoid automatic rent-growth assumptions. The BLS Houston summary updated October 5 reports August payrolls up 1.3% from a year earlier, using nonseasonally adjusted data. That is evidence of job growth, not a count of new renter households, and it cannot tell an owner which residents can absorb a renewal increase.
What it means for owners and investors
Start with the debt-service constraint. When borrowing costs rise and income stays flat, the same loan balance consumes more cash, leaving less coverage above required payments. If a lender limits proceeds by coverage, an owner may need to contribute equity even when the property has maintained occupancy and paid its existing loan on time.
Then examine valuation independently. A capitalization rate converts property income into an asset price; a higher required cap rate produces a lower value for the same NOI. Higher Treasury yields can raise investors’ alternative return expectations, but they do not dictate an identical increase in apartment cap rates. Growth expectations, asset quality and competition for acquisitions also affect pricing.
That creates two possible constraints at refinancing: debt supported by cash flow and debt supported by appraised value. Meeting one does not guarantee meeting the other. An owner should request a written financing indication using current collections, then compare the proposed proceeds with the payoff balance, closing costs and reserves before calling the refinance funded.
There are structural choices to assess as well. In an October 5 discussion, Walker & Dunlop examines FHA rate buydowns and prepayment options for transactions challenged by higher borrowing costs. Paying upfront for a lower rate can improve coverage, but the decision still depends on incremental savings, additional proceeds, expected holding period and the cost of giving up flexibility.
For acquisitions, a lower basis can absorb some financing pressure, but price alone does not repair weak collections or deferred maintenance. Buyers should test the cash yield after realistic debt service and capital spending. At exit, underwriting both a healthy NOI recovery and a lower cap rate makes the outcome depend on two favorable changes occurring together.
What to watch next
Watch official Treasury observations alongside actual lender spreads and quoted proceeds. A decline in the benchmark helps only to the extent that lender pricing and the rest of the structure allow it through. Owners with near-term maturities should track financing availability and the equity gap, rather than waiting for a headline yield to reach a preferred level.
On operations, the useful evidence is a sustained improvement in collected revenue after concessions, coupled with controlled expenses and fewer vacant days. Upcoming Houston apartment reports can help test whether the recovery is broadening, while property results establish whether it is reaching the borrower. Better leasing buys breathing room; refinancing still needs its own proof.