53% Office Leasing Drop Puts Houston’s Apartment Commutes in Focus
Houston’s latest office report points to shifting employment locations, with apartment upside that depends on actual leases and collected income.

Key takeaways
- 53%: Houston Q3 office leasing decline from Q3 2025, according to CBRE.
- 143,000 square feet: Westlake’s new office footprint, versus 110,000 at its former location.
- 0.5%: Revised Houston payroll growth year over year through July in the Dallas Fed series.
- 11.1%: Houston Q2 stabilized apartment vacancy in Cushman & Wakefield’s report.
Houston apartment investors have a fresh reason to study the commute map. In its third-quarter office report, dated October 6, CBRE says leasing activity fell 53% from a year earlier even as several tenants shifted locations within the region. Those moves could redirect apartment demand toward particular corridors without creating a matching increase in Houston households.
The investment question is whether a property can capture that redistribution at a sensible cost. A nearby employer move may improve leasing prospects, but it does not justify assuming faster metro rent growth. For owners building next year’s budget, the distinction belongs in both the revenue forecast and the price they are willing to pay.
A larger footprint is not a headcount forecast
Westlake moved within the West Loop/Galleria from 110,000 square feet to 143,000 square feet, according to CBRE. Magnolia Oil & Gas moved from Greenway Plaza to Katy Freeway, while Rockcliff Energy Management signed a sublease to relocate from downtown to Katy Freeway. CBRE also says net absorption slipped into negative territory during the quarter.
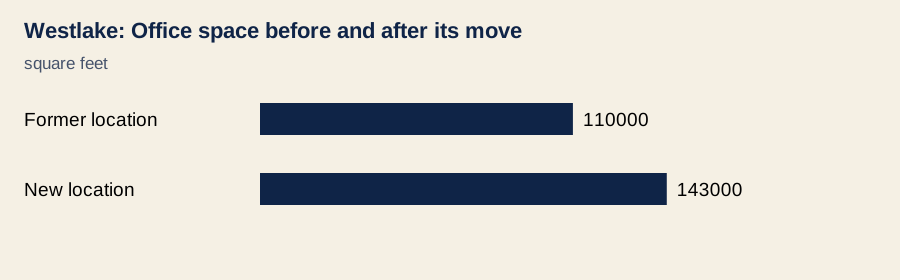
Source: CBRE Houston Office Figures Q3 2026, October 6. One tenant; former and new locations in West Loop/Galleria. Floor area, not employees or apartment demand.
Westlake’s larger office gives investors a concrete location signal. It does not reveal how many employees were hired, how often they attend the office, or how many need a new apartment. Square footage can reflect meeting space, workplace design or consolidation; converting it directly into renter households would put precision where the evidence offers none.
The westward pattern has an earlier reference point. Colliers’ second-quarter office report identified Katy Freeway East as the strongest submarket for positive absorption, with Dow Chemicals occupying 203,000 square feet at City Centre Six. That is prior-quarter evidence from another brokerage, not a second measure of CBRE’s third-quarter leasing decline.
A tenant move can benefit apartments near the destination and weaken the relative appeal of apartments near the former office. Yet residents may retain their existing lease, share housing or tolerate the commute. The financial benefit arrives only when that location preference becomes a signed lease, a renewal or a reduction in vacancy time.

Houston’s jobs backdrop remains uneven
The Dallas Fed’s September Houston indicators put revised year-over-year payroll growth through July at 0.5%, or 17,500 jobs. Over April through July, construction grew at a 10.4% annualized rate, oil and gas at 9.0%, and professional and business services at 5.7%. Those selected growth rates describe a three-month interval, not the full year.
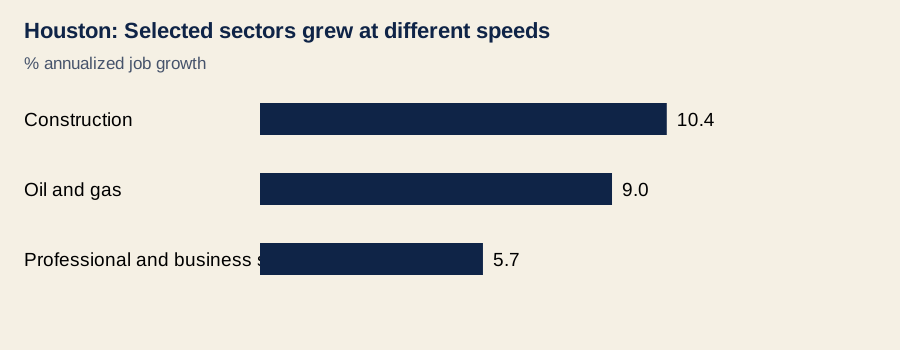
Source: Dallas Fed Houston Economic Indicators, September 4, 2026. April–July 2026; selected sectors only. Annualized three-month rates, not year-over-year growth.
That mix matters because an office address is only one part of the demand story. Construction workers, business-service employees and energy workers have different work locations, schedules and housing needs. A property that relies on one office tenant faces a different leasing risk from a property serving several employers and industries.
The published employment series also require care. The BLS Houston summary reports nonseasonally adjusted July payroll growth of 1.5%, or 50,300 jobs, while the Dallas Fed reports 0.5% after incorporating revisions. Adjustment and data vintage differ; these are not interchangeable readings, and averaging them would manufacture a statistic neither organization published.
Statewide conditions add context rather than a Houston forecast. The Dallas Fed’s October 5 Texas update describes continued employment expansion alongside flat September service activity and weakening housing activity. A positive state trend can coexist with modest local household growth, so the apartment budget still needs evidence from the property’s own applicants and residents.
Office demand must pass the apartment test
Houston apartments entered this office-report release with an unfinished recovery. Cushman & Wakefield’s Q2 apartment report recorded 11.1% stabilized vacancy and effective rent of $1,312 per unit, down 2.3% year over year. Those figures are dated apartment fundamentals, not a current rent quote for the Galleria or Katy Freeway.
A shorter commute may increase qualified inquiries, but competing apartments can capture the same benefit. Nearby lease-ups, concessions and differences in unit quality determine how much demand reaches an individual building. Owners should examine competing properties along actual commuting routes instead of drawing a circle around a new headquarters and assuming every apartment inside wins.
CBRE’s 2026 national multifamily outlook emphasizes the connection between sluggish hiring, household formation and operators’ focus on occupancy. The local application is straightforward: measure collected revenue and resident retention alongside advertised rent. A promising employer announcement earns attention; the rent roll decides whether it earns a higher valuation.
What it means for owners and investors
Owners can begin with a practical leasing review: ask applicants what brought them to the area and track whether employer-related inquiries become qualified leases. Compare move-in timing with reported office occupancy, rather than with the announcement date alone. Record the information consistently so a handful of encouraging tours does not become an assumed demand trend.
The first potential gain is lower turnover and fewer vacant days. That can support net operating income, or NOI, even when asking rents barely move, because retained residents reduce make-ready expense and leasing costs. Higher operating payroll, maintenance and insurance expense can still absorb the benefit, so revenue improvement and expense control need separate assumptions.
Debt service follows cash flow rather than office-leasing headlines. A buyer should test whether collected rents cover the existing loan and a refinance under slower lease-up and persistent concessions. Employer proximity helps explain the property’s appeal; it cannot fill a cash-flow shortfall or guarantee lender proceeds when the loan matures.
For acquisition basis, pay for demonstrated access and leasing performance, then treat unproven demand as upside. Cap-rate compression should remain a separate assumption from NOI growth: stronger occupancy does not establish that future buyers will accept a lower yield. At exit, the relevant proof is durable resident demand across employers, supported by operating results and comparable apartment transactions.
What to watch next
Watch whether westward office moves become occupied workplaces and whether nearby apartments report better qualified traffic, renewals and collected rent. Then compare those improvements with concession changes and competing deliveries. That sequence can distinguish a lasting neighborhood advantage from a brief marketing bump.
The next office report should clarify whether the leasing decline persists, while revised employment data can test how broad hiring has become. Until the apartment evidence improves, Houston investors can recognize the corridor opportunity and keep the underwriting restrained. The commute map is useful; it is not a substitute for the cash-flow statement.